
Clarifying the Full-Spectrum Concept Again
"Full spectrum" is a colloquial term in the lighting industry, not a mandatory national-standard term, nor is there a unified legal criterion for it. It usually describes: a light source whose spectral curve in the visible 380–780nm band is continuous and smooth with complete band coverage, filling in the cyan and long-wavelength red regions commonly missing from conventional blue-chip white LEDs, suppressing harmful short-wavelength blue peaks, and making the spectral shape as close to natural light as possible. Ordinary white LEDs mostly use a blue chip plus yellow phosphor solution, with prominent blue peaks, insufficient red energy, obvious gaps in the middle of the spectrum, limited color rendering, and light quality that tends to be harsh.
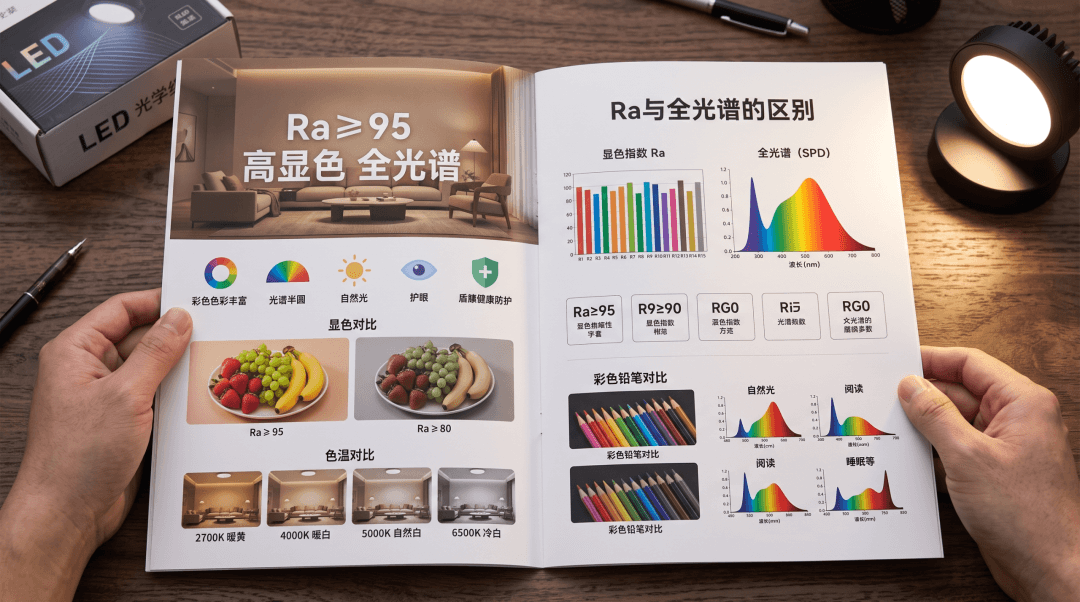
What buyers must be reminded of: artificial full spectrum is not equal to real sunlight. It is only a simulation of the daylight spectrum and does not contain the large amount of ultraviolet in sunlight. Many low-priced lamps on the market are "pseudo full spectrum," merely adding a small amount of red light while the spectral curve still has obvious troughs and gaps; the four characters on the promotional page cannot serve as a basis for acceptance.
| Type | Spectral structure characteristics | Common problems |
|---|---|---|
| Ordinary white LED | Blue chip + yellow phosphor, prominent blue peak | Insufficient red light, obvious gaps in the middle bands |
| Pseudo full spectrum | A small amount of red light supplemented, curve still has troughs | Bands not continuous, gaps not truly filled |
| Broad-spectrum solution | Relatively complete coverage of cyan, green, and long-wavelength red | Must be verified by measured SPD curves |
Therefore, to determine whether a luminaire truly has a wide spectrum, one should not rely solely on promotional labels, but should request and verify the SPD spectral power distribution curve, observing whether the curve is smooth and whether there are obvious dips in the cyan and long-wavelength red regions. This is the foundation for all subsequent discussions of color rendering and blue light metrics.
The misconception of Ra≥95
In procurement communication, the most common misjudgment is equating Ra≥95 directly with full spectrum. Ra (general color rendering index) evaluates the average color rendition result of a set of standard color samples, whereas full spectrum describes the light source's own spectral structure, band continuity, and coverage. The two are related but by no means equivalent. Two lamps with the same color temperature, similar chromaticity coordinates, and both achieving Ra of 95 can, through the metamerism effect, have completely different SPD curves behind them: some are continuous and smooth, while others still have obvious band gaps, merely scoring high on this particular set of CRI standard color samples.
More notably, Ra only takes the average of 8 moderately saturated color samples, and R9 (saturated red) is not included. Many luminaires claiming Ra95 have low R9, causing reds and skin tones to render gray and dull, and the warm, rich texture of wood, leather, and fabric is consequently lost. For school scenarios, the red signage, colorful teaching aids, student skin tones, and clothing in classrooms are precisely highly dependent on the performance of long-wavelength red light and R9.
| Judgment dimension | What Ra≥95 can indicate | What it cannot indicate |
|---|---|---|
| Spectral shape | The basic spectrum is usually not too poor | Whether the curve is continuous, and whether there are dips in cyan and long-wavelength red |
| Saturated red | — | The level of R9, and whether reds and skin tones appear gray |
| White light appearance | — | The direction of Duv shift, and whether it leans green or pink |
Therefore, the core basis for judging whether a spectrum is truly wide and continuous is the SPD spectral curve, not a single Ra value. During procurement, one may treat Ra as a threshold and use R9, SPD curve, Duv, and blue light等级 as verification items, requiring suppliers to provide verifiable spectral data rather than just looking at a single number on a promotional page.
Wide-spectrum multi-metric evaluation
To determine whether a lamp truly has a wide spectrum, one should not focus on a single number alone. For school and education-system buyers, the more reliable approach is to require suppliers to provide a set of cross-verifiable metrics: Ra≥95 as the baseline threshold, R9 saturated red color rendering index listed separately, blue light hazard rating reaching RG0, combined with Duv color point deviation, TM-30 Rf and Rg, and color vector graphic for comprehensive judgment. Products with impressive single parameters but missing other metrics often fail to withstand real-world scenario testing.
- Ra (general color rendering index):Reflects the average rendering capability across 8 standard medium-saturation color samples; simple and universal, but looking only at the average cannot reflect spectral shape and is insufficient for describing high-saturation colors and material texture.
- R9 (saturated red):Not included in the Ra average; directly affects the rosy appearance of skin tones and the warm texture of wood and leather. Many Ra95 luminaires have low R9, resulting in a grayish and dull appearance in actual photographs.
- TM-30:A more advanced color evaluation system; Rf represents color fidelity, Rg represents overall saturation change, and together with the color vector graphic, the shift trends of different hues can be observed.
- Duv:The deviation of the color point relative to the blackbody locus; positive values tend toward a green tint, negative values tend toward a pink tint; luminaires with the same color temperature and same Ra can produce completely different white light perception due to Duv differences.
- SPD spectral power distribution:The core basis for identifying genuine wide-spectrum; it visually shows the blue light peak, cyan gap, green plateau, and long-wavelength red energy, allowing judgment of whether the curve is continuous and free of gaps.
| Metric | Function | Procurement focus |
|---|---|---|
| Ra | Average color rendering capability | ≥95, as the baseline threshold |
| R9 | Saturated red rendition | Listed separately to avoid being masked by the average |
| TM-30 | Fidelity and saturation | For high-end scenarios, add Rf, Rg and vector graphics |
| Duv | White light perception shift | Control color point stability |
| SPD | Underlying spectral structure | Request the curve chart to check for gaps |
It should be noted that two lamps with the same color temperature, similar color coordinates, and Ra both above 95 may, due to metamerism, have completely different SPD curves behind them: some are continuous and smooth, while others still have obvious band gaps, yet happen to score high on the CRI standard color samples. Therefore, when evaluating broad-spectrum performance, the SPD curve should be taken as the main line and other metrics as cross-validation, rather than drawing conclusions from one or two numbers.
Tunable spectrum and scene matching
In procurement, "tunable spectrum" is often confused with ordinary color temperature adjustment, but the two are not equivalent. Ordinary color temperature adjustable luminaires usually mix and dim two fixed SPDs, cool white and warm white, so the spectral curve shape is basically fixed and only the ratio changes; tunable spectrum systems use multi-channel independent LEDs (red, green, cyan, amber, etc.) mixed together, and can actively adjust the energy ratio of each band while keeping color temperature and Duv stable, allowing the same luminaire to switch between "high-fidelity rendering" and "enhanced material vividness." The key to judging the quality of a tunable spectrum is not the number of channels, but whether the color point, color rendering and spectrum remain controllably stable throughout dimming.
Spectrum is only the basic condition of lighting and must also match the trade-offs of the scene. No matter how beautiful the spectral curve is, if the color temperature does not match, Duv is out of control, glare is uncontrolled, illuminance is insufficient, or light distribution is unreasonable, it is still an unqualified lighting solution. Schools and education system procurement can refer to the following scene priorities:
- Classrooms, library reading areas, offices and study rooms: prioritize stability and comfort, low glare, and faithful color; color temperature and illuminance should be planned uniformly according to spatial function.
- A art classrooms, exhibition halls and display spaces: prioritize color fidelity and exhibit protection, focusing on Rf, Rg and color vector graphic performance.
- B clothing, jewelry, retail display: balance material gloss and translucent texture on the basis of color accuracy.
| Comparison items | Ordinary color temperature tuning | Tunable spectrum system |
|---|---|---|
| Spectral curve | Fixed, only ratio changes | Can adjust band energy at fixed color temperature |
| Color point stability | May shift with dimming | CCT and Duv controllable throughout |
| Applicable requirements | Basic brightness and cool-warm adjustment | Balance faithful rendering and material performance |
For buyers, tunable spectrum is not a stack of parameters but a light quality solution requiring documentary verification: require suppliers to provide SPD curves and color point data across the full dimming range, confirm that color rendering and blue light levels remain controlled at different levels, and then match with the classroom's actual ceiling height, illuminance and anti-glare structure, avoiding "tunable" remaining only on promotional pages.
Procurement documentation requirements and evaluation approach
For school and education-system buyers, before writing "full spectrum" into tender documents, turning it into a verifiable documentation checklist is more effective than comparing labels on promotional pages. It is recommended to require suppliers to provide measured data along with their quotations at the inquiry stage, rather than only brochure specifications, and to incorporate key indicators into the technical response table as the basis for comparison during incoming inspection.
- Request the SPD spectral power distribution curve (full 380–780nm range), and check whether the curve is continuous and smooth, whether there are obvious dips or gaps in the cyan region and long-wavelength red region, and whether the blue-light peak is effectively suppressed.
- For color rendering indicators, look at the combination rather than a single value: use Ra as the threshold, focus on verifying the R9 saturated red index, and add TM-30 Rf, Rg and color vector graphics as well as Duv color point deviation depending on scenario requirements.
- Verify that the blue light hazard rating is RG0, and confirm the test conditions and luminaire state corresponding to this conclusion, rather than only for a single light source.
- Require measured reports from the same batch or same series, noting the testing institution and test conditions, to avoid using sample data to represent mass-production consistency.
| Verification item | Focus point | Common risk |
|---|---|---|
| SPD curve | Continuity, gaps, blue-light peak | Only a small amount of red light added; the curve still has troughs |
| Ra and R9 | Whether R9 meets the standard simultaneously | Ra is high but R9 is low, giving a grayish appearance |
| Blue light hazard class | Whole luminaire RG0 | Only the light source class is marked |
On this basis, further verify color temperature, illuminance, glare control and light distribution design against the actual classroom scenario. Spectrum is a bonus for light quality, not the whole story; a visible curve, cross-validated with multiple metrics, is the practical, verifiable logic for procurement decisions.